So I love interactive graphics. I also enjoy 3D graphics, when they are necessary, and RGL suites me pretty well for them.
I recently forked a github repo (https://github.com/trestletech/shiny-sandbox), and just made a quick working example of how to make a 3D scatterplot with options of changing data sets, and taking certain types of points out (WM – white matter, GM – gray matter). Try it out here: https://github.com/muschellij2/shiny-sandbox.
Hopefully in the future I can get the camera angles and matrix rotation to stay fixed when adding/deleting points.
Edit: If you clone the repository (using git clone), load up R,
library(shiny), and setwd into the repo directory, and just run
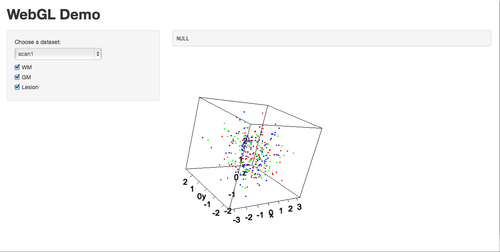
runApp() in R, you should see This screen
