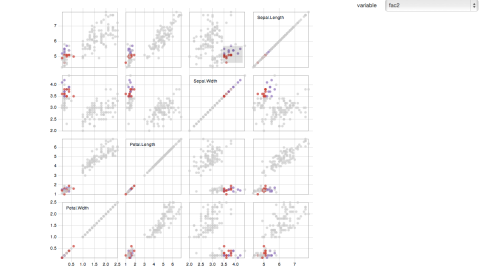
Recently, @simplystats recently released the healthvis package http://t.co/mW0yZEs8wy. As such, I finally got up my courage to take a shot at adapting the iris scatterplot matrix brushing example, which is essentially R’s matplot function, in healthvis. I also am “apart” of the group that’s doing this, so I thought it was necessary to show people that it’s possible
Step 1) Read http://healthvis.org/develop/ completely and follow it step by step. I had an old version of Python (2.6) (and a new one, 2.7, installed in a custom directory), so that was somewhat fun. I installed Python fresh again, and also put a symbolic link to python2.7 in /usr/bin (as this was where Google App Engine was looking). For windows users, this isn’t a problem, but Unix – symbolic link means alias/shortcut, (sudo ln -s /Library/Frameworks/Python.framework/Versions/2.7/bin/python /usr/bin/python2.7). Also I believe you have to source the AllClasses.R, healthvisMethods.R IN ORDER otherwise you may get an error.
Step 2) Find your favorite d3 graphic. The d3 gallery has a bunch of examples: https://github.com/mbostock/d3/wiki/Gallery
Step 3) Passing data into d3. Disclaimer, I don’t know much about d3.
So d3.csv (and I think d3.json) passes each row of a “dataset” as a specific element of an array, with the column names as the names of the objects within the element. If that’s confusing, think of a dataset with 3 columns (x, y, z) and 100 rows. When d3 reads that data in, from what I can tell, it has an array of 100 elements, where each element has 3 components, one labeled x, one y, one z, with the values. Also – it seems as though numerics are all passed as strings (at least in my example with d3.js.
Now to do this in R, (see https://gist.github.com/muschellij2/5310615 for code to copy)
require(RJSONIO) ## for toJSON
nr <- nrow(data) #
ll <- vector(“list”, length=nr)
for (irow in 1:nr) ll[[irow]] <- data[irow,]
js <- toJSON(ll, pretty=TRUE)
So overall, I simply made a list of the data set by looping over rows. This is not the most efficient way – but it worked at the time. Also my strategy is get it working, get it working efficiently, and then get it working prettily. So now I just create a JSON object (names js), that has all the data in JSON format, in a character string.
I then pass this data into the d3params file (again – see development page above).
Now in javascript, to get the data, we have
this.json = d3Params.json;
this.json = JSON.parse(this.json);
Now, this.json is in the same format as the data you would get from d3.csv. Now wherever you see “data” you put “this.json”. You should be ready to go when you want. Example of output below:
The example output is where you now have a drop-down box to change the colors of the data points depending on different discrete factors. Also if you highlight a few points in a plot – it shows how those points fall in the other scatterplots.
Step 3) Tweak original d3 script. Now you have your data and it’s all fun and games from here right? Partly. So anything you define in this.init or this.initalize are treated as they would be locally in that function. If you want to use things across this.init, this.visualize, or this.update, define them globally outside these functions. That said – d3 already attaches the data and such, so it should probably only be reusable functions that you need in multiple this functions. (I’m not sure if you define the function as this.function it gets around this – I believe it would, but didn’t investigate).
Step 4) Update! Now for what I did – I passed in a variable called “dropouts” (as to denote which aren’t numeric and therefore to drop out of the scatterplot matrix), which are the discrete factors by which I want to color the plot. Now you need to add some things into this.update for your transition/interactions. For example here, I passed the names of the dropout variables in my varList for healthvis, and retrieve them in this.update using formdata[0].value. That then allows me to call the circles in d3 and then color them by the value of the variable chosen in the dropdown.
Comments – It sounds like a lot. But let me clarify this: April 2nd it was released, I finished the app yesterday. It was one day, and I had classes, and other stuff. So by a lot I mean I don’t know d3 well enough to be fluent and needed a lot of console.log(“blank = “, blank) statements to figure out what was going on. So if you know R, have seen javascript, you can make some cool visualizations. Take 20 mins to set up your system and clone the repo. Take 20 minutes finding some application that would be relevant for your work (that hopefully someone else has implemented in d3). Then take 2 hours trying to get it to work (again get it to work, then efficient, then pretty). If you can’t get it done by then, take a break, and I bet in the next 2 days (if you have time), I’ll see your healthvis app all over the place. Or just email healthvis and hope they implement it for you.
